
In order to improve your machine learning model, it is crucial to train it on high-quality data. Identifying problems in your data, particularly when you have a large amount of data, can lead to poor performance in your machine learning models. One common issue is mislabeled data, which can be found in even the most widely-used benchmark datasets.
Improving model performance by addressing mislabeled data is crucial and can have a much greater impact than just tweaking the hyperparameters. This is because you will be essentially fine-tuning the model to predict the mislabeled data. However, identifying these problematic records can be difficult, especially when you have a lot of data.
Here are some ways how you can do it
Exploratory topic analysis
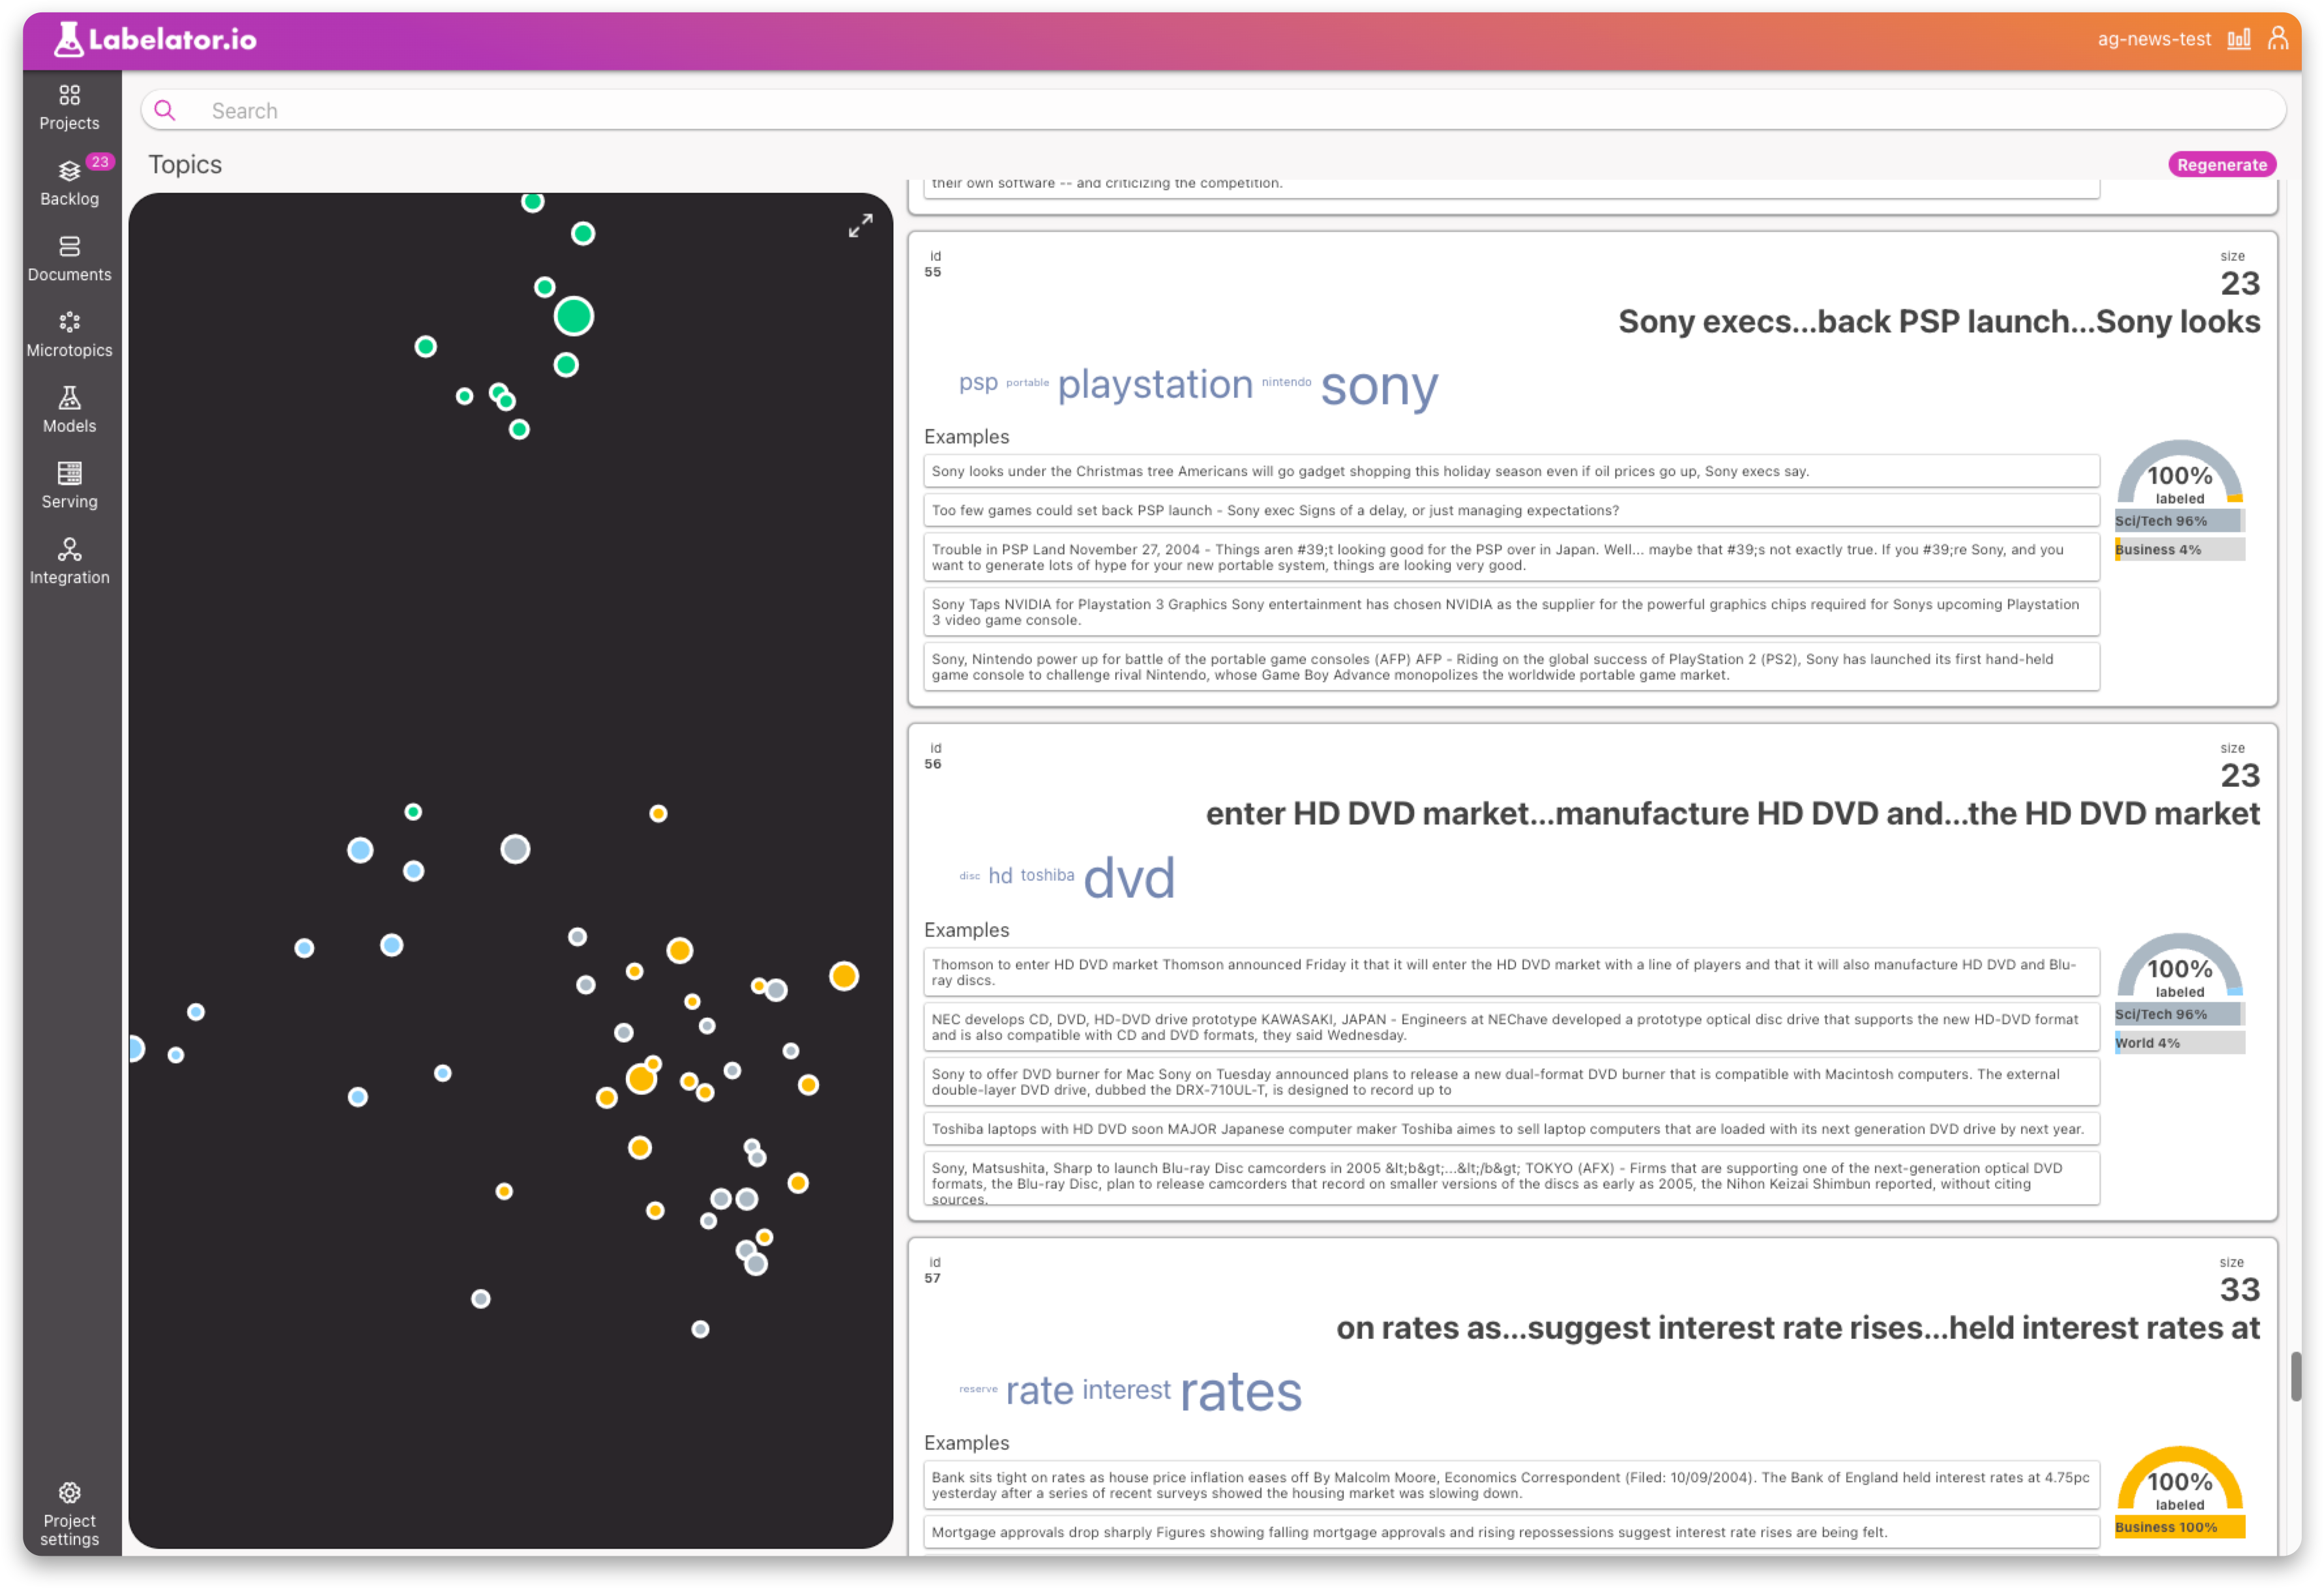
Clustering similar records into topics and visualizing them alongside the class distribution within the topic can be one way to improve real-world performance. This is because these topics reflect clear patterns that the model is more likely to catch during training. The existence of the cluster itself shows that there is a significant amount of this "type" of data in the dataset.
It is important to use an appropriate clustering algorithm. At Labelator.io, we use HDBSCAN, which is very good at identifying dense regions of similar data and excluding outliers. This method will help identify the most obvious patterns within the data.
This can help us to identify the most obvious problems within the data. For example we may discover clusters where all records are labeled incorrectly. In Labelator.io, this is an easy fix as we can select all of the records and change all the labels at once.
We might also observe some inconsistently labeled data within the same topic in dataset. These is not necessarily a bad thing. For example, a cluster may contain records discussing the same topic, such as World War II and Nazism, but some are labeled as dangerous and others are not. A closer look may reveal that while most records are true Nazi propaganda, a few are more akin to historical accounts written by an expert historian of that period. If most records in this topic are labeled as dangerous, the ML model may conclude that just mentioning this topic should be treated as dangerous. In this case, it is best to equalize the ratio of records for both labels by providing more examples for the type of data that is being incorrectly predicted, so the model is forced to learn the difference between these two subtypes of data within this topic.
At Labelator.io, we use several tricks during topic analysis such as "UMAP based" projection to lower dimensionality space, taking the labels into account during transformation. This means that regenerating topics after changing labels could lead to different clusters, which would essentially try to split the clusters based on labels if a clear distinction between these data is found. Running topic analysis on high-dimensionality data can be tricky and may require a lot of memory. If you are not using Labelator.io, we recommend using the BERTopic library, which encompasses common best practices and techniques.
Reviewing wrong predictions
When you examine your wrongly predicted data, there are typically two situations that can occur. The first is that the record was correctly labeled, but the prediction was incorrect. The second is that the prediction was accurate, but the labels in your dataset are dirty. It's important to understand that metrics are calculated on potentially dirty data. Even in the best datasets, there is a certain percentage of mislabeled records.
Next thing what you need is to realize is understand whether the record that we are reviewing was part of the training or evaluation part of the dataset. If it was in the training data, it can weaken the model's confidence and potentially cause undesirable shifts in predictions. On the other hand, if it was in the evaluation dataset, it can make it difficult to compare models and trust your metrics.
Anyway, it is safe to say that the less incorrectly labeled data we have the better...
To effectively address this issue we want to start by targeting the chunks of data, where the impact will be the greatest. One way to do this is by identifying the areas where the model is most confused and focusing on those. The confusion matrix is a great tool for visualizing this information.
(To learn more about confusion matrix, you can check our docs on this topic)
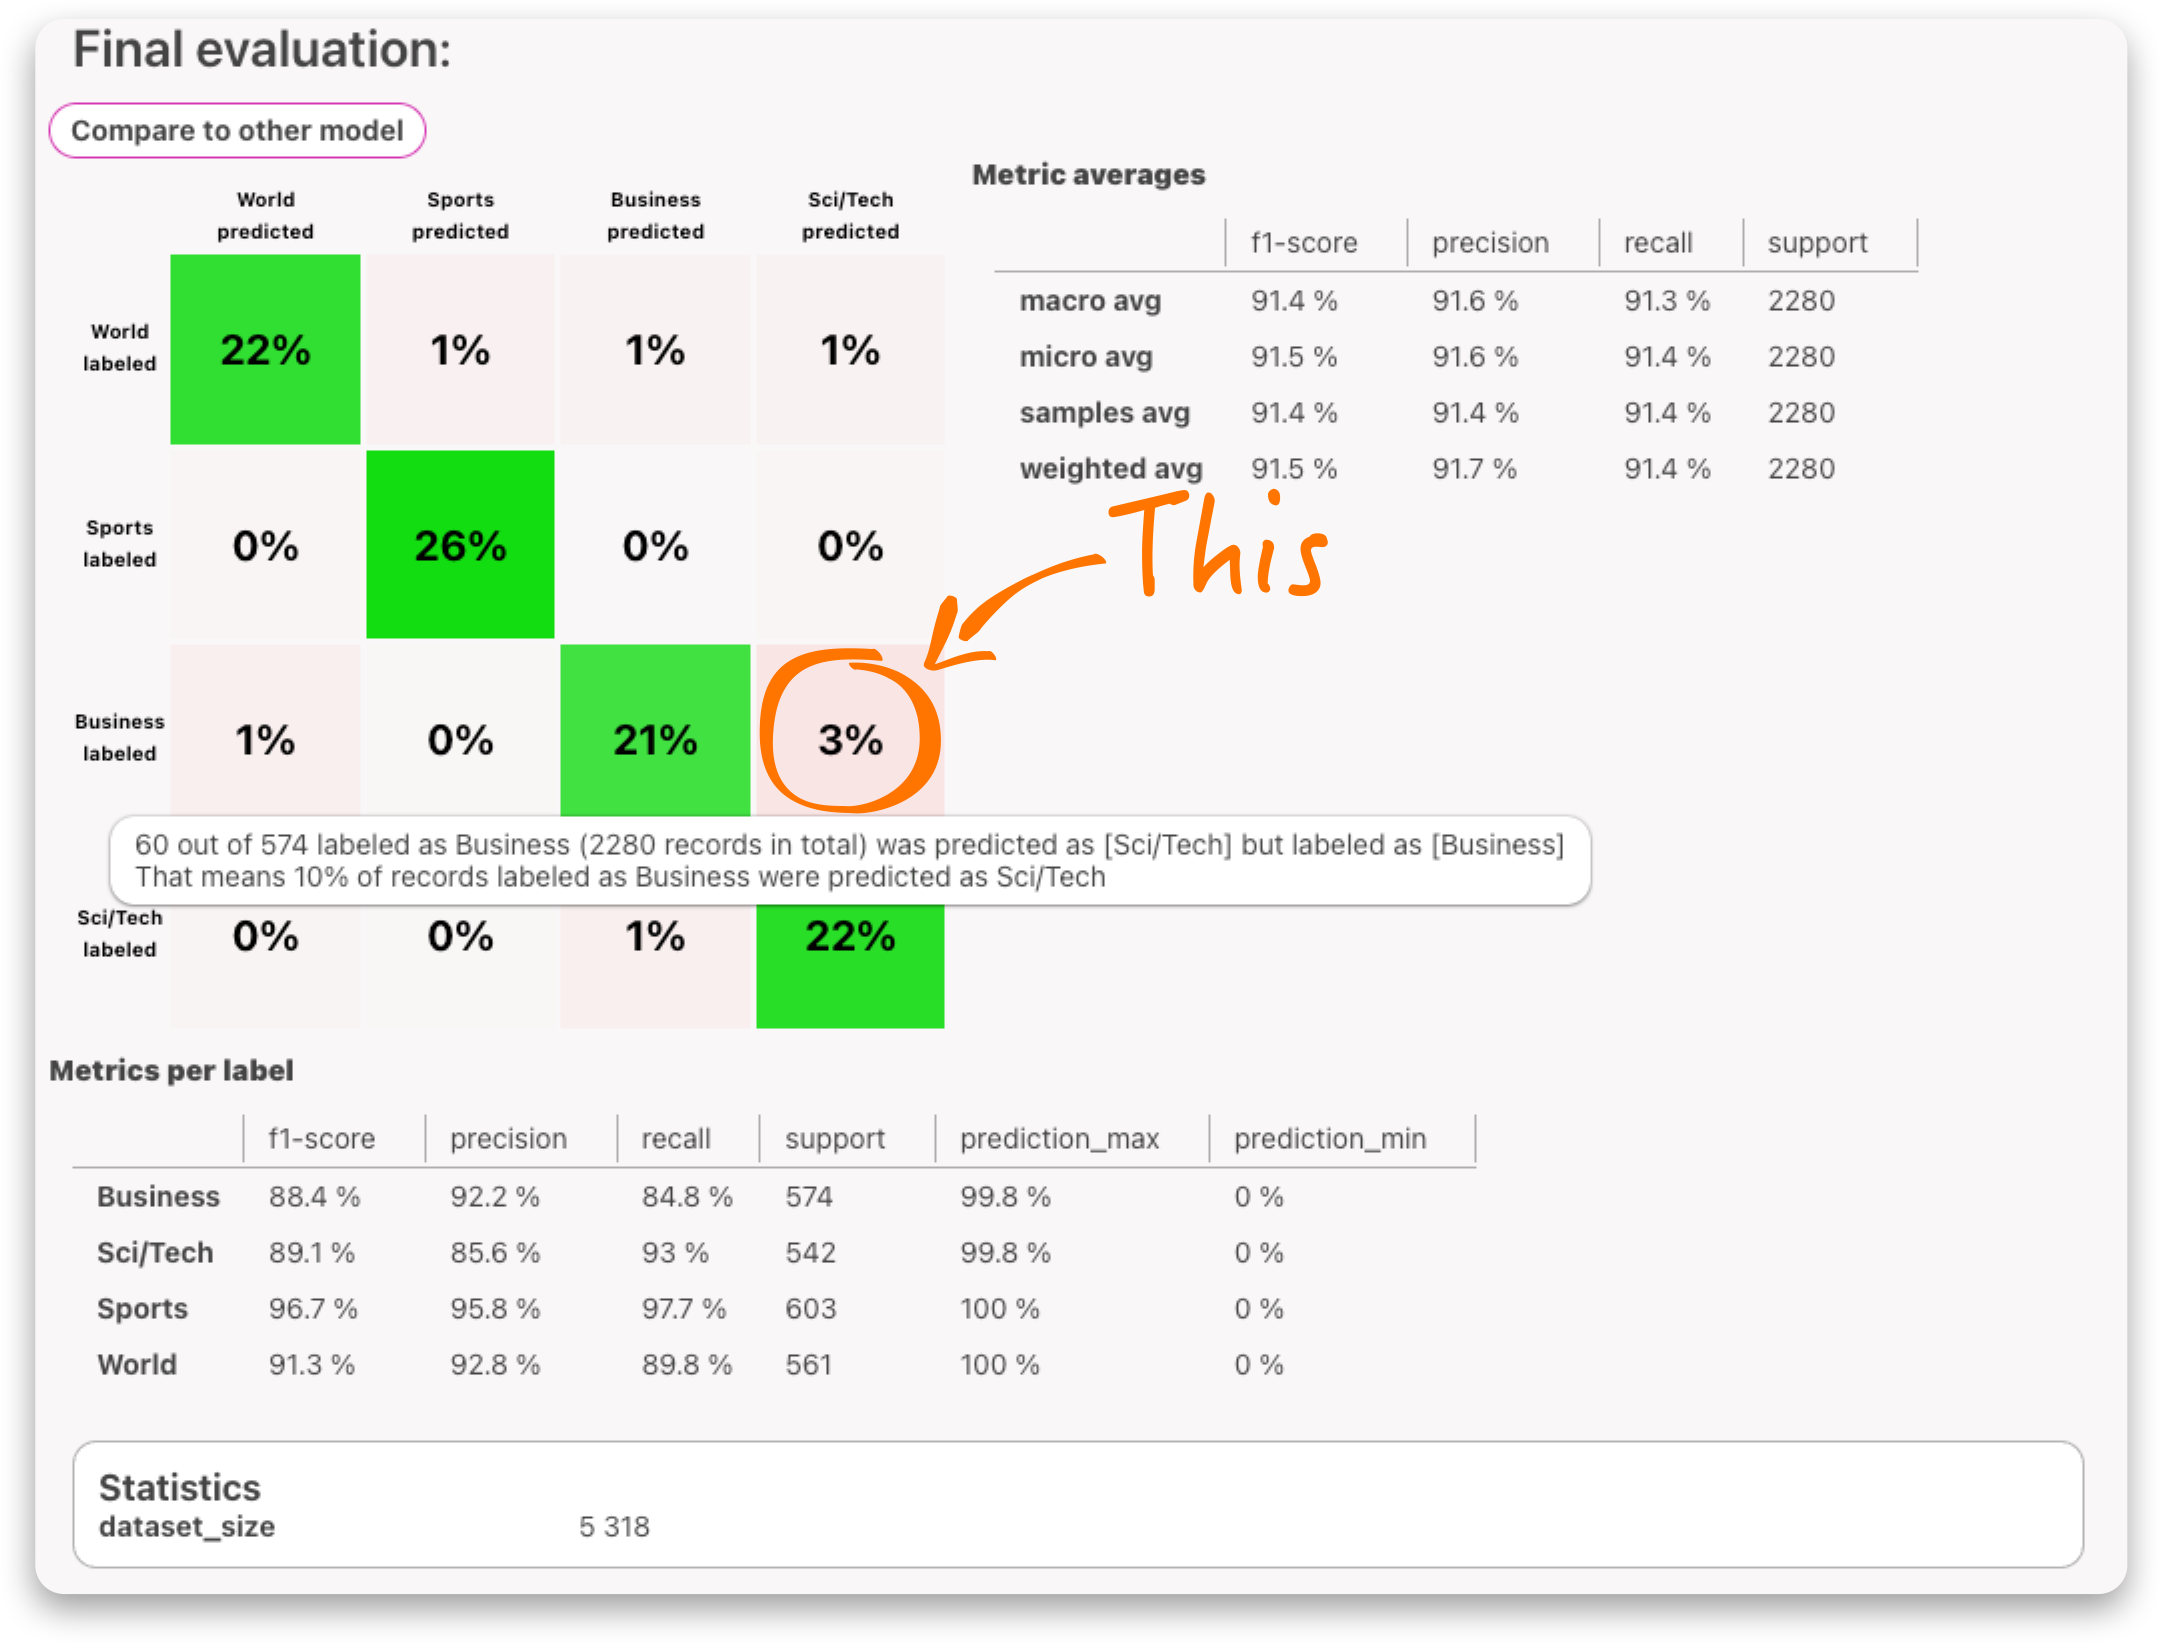
In Labelator.io, you can simply click on the cell with the highest percentage in the confusion matrix and be directed to the Documents section with a filter that targets those specific records. Here you can review possible mislabels and look at similar records to determine if they are also mislabeled or if there are not enough similar examples to learn from.
Targeting specific cases
When we have tackled the most obvious issues, we still come across instances where the model made a mistake. In such cases, we can review similar cases to try and understand why the mistake was made. However, finding similar cases can be quite challenging. One way to do this is by using keywords, but this is not very effective and reliable approach.
Labelator.io offers a solution with semantic search. It uses the same underlying model to understand the meaning of documents in the dataset as it uses for predictions. This means that when you search for documents similar to any test query or documents, we are looking at the data through the same lens as the AI, helping us understand the data in the same way as the AI.
This is a powerful tool to help us understand why the model made such a prediction and greatly aid in solving problems during training. What we should do here is:
- review the labels of the most similar documents
- if needed, add more examples similar to the incorrectly predicted record to reinforce the weight of the wrong decision in this type of data
In the next article, we will cover how to identify these records and catch these cases when running our model in production, so stay tuned🤗!